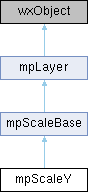
Plot layer implementing a y-scale ruler. More...
#include <mathplot.h>
Public Member Functions | |
| mpScaleY (const wxString &name=wxT("Y"), int flags=mpALIGN_CENTER, bool ticks=true) | |
| virtual bool | IsHorizontal () const override |
| virtual void | Plot (wxDC &dc, mpWindow &w) override |
| Layer plot handler. | |
| virtual bool | HasBBox () const override |
| Check whether this layer has a bounding box. | |
| virtual double | TransformToPlot (double x) const override |
| virtual double | TransformFromPlot (double xplot) const override |
| void | SetMasterScale (mpScaleY *masterScale) |
| void | SetAlign (int align) |
| Set X axis alignment. | |
| void | SetNameAlign (int align) |
| void | SetTicks (bool enable) |
| Set X axis ticks or grid. | |
| bool | GetTicks () const |
| Get X axis ticks or grid. | |
| void | GetDataRange (double &minV, double &maxV) const |
| virtual void | ExtendDataRange (double minV, double maxV) |
| virtual void | ResetDataRange () |
| double | AbsMaxValue () const |
| double | AbsVisibleMaxValue () const |
| void | SetAxisMinMax (bool lock, double minV, double maxV) |
| bool | GetAxisMinMax (double *minV, double *maxV) |
| virtual bool | IsInfo () const |
| Check whether the layer is an info box. | |
| virtual double | GetMinX () const |
| Get inclusive left border of bounding box. | |
| virtual double | GetMaxX () const |
| Get inclusive right border of bounding box. | |
| virtual double | GetMinY () const |
| Get inclusive bottom border of bounding box. | |
| virtual double | GetMaxY () const |
| Get inclusive top border of bounding box. | |
| const wxString & | GetName () const |
| Get layer name. | |
| const wxString & | GetDisplayName () const |
| const wxFont & | GetFont () const |
| Get font set for this layer. | |
| const wxPen & | GetPen () const |
| Get pen set for this layer. | |
| void | SetContinuity (bool continuity) |
| Set the 'continuity' property of the layer (true:draws a continuous line, false:draws separate points). | |
| bool | GetContinuity () const |
| Gets the 'continuity' property of the layer. | |
| void | ShowName (bool show) |
| Shows or hides the text label with the name of the layer (default is visible). | |
| virtual void | SetName (const wxString &name) |
| Set layer name. | |
| void | SetFont (const wxFont &font) |
| Set layer font. | |
| void | SetPen (const wxPen &pen) |
| Set layer pen. | |
| mpLayerType | GetLayerType () const |
| Get layer type: a Layer can be of different types: plot lines, axis, info boxes, etc, this method returns the right value. | |
| bool | IsVisible () const |
| Checks whether the layer is visible or not. | |
| void | SetVisible (bool show) |
| Sets layer visibility. | |
| const wxBrush & | GetBrush () const |
| Get brush set for this layer. | |
| void | SetBrush (const wxBrush &brush) |
| Set layer brush. | |
Protected Member Functions | |
| virtual void | getVisibleDataRange (mpWindow &w, double &minV, double &maxV) override |
| virtual void | recalculateTicks (wxDC &dc, mpWindow &w) override |
| void | computeSlaveTicks (mpWindow &w) |
| void | updateTickLabels (wxDC &dc, mpWindow &w) |
| void | computeLabelExtents (wxDC &dc, mpWindow &w) |
| virtual void | formatLabels () |
Protected Attributes | |
| mpScaleY * | m_masterScale |
| int | m_flags |
| bool | m_ticks |
| std::vector< double > | m_tickValues |
| std::vector< TICK_LABEL > | m_tickLabels |
| double | m_offset |
| double | m_scale |
| double | m_absVisibleMaxV |
| int | m_nameFlags |
| double | m_minV |
| double | m_maxV |
| bool | m_rangeSet |
| bool | m_axisLocked |
| double | m_axisMin |
| double | m_axisMax |
| int | m_maxLabelHeight |
| int | m_maxLabelWidth |
| wxFont | m_font |
| wxPen | m_pen |
| wxBrush | m_brush |
| wxString | m_name |
| wxString | m_displayName |
| bool | m_continuous |
| bool | m_showName |
| mpLayerType | m_type |
| bool | m_visible |
Detailed Description
Plot layer implementing a y-scale ruler.
If align is set to mpALIGN_CENTER, the ruler is fixed at X=0 in the coordinate system. If the align is set to mpALIGN_TOP or mpALIGN_BOTTOM, the axis is always drawn respectively at top or bottom of the window. A label is plotted at the top-right hand of the ruler. The scale numbering automatically adjusts to view and zoom factor.
Definition at line 829 of file mathplot.h.
Constructor & Destructor Documentation
◆ mpScaleY()
| mpScaleY::mpScaleY | ( | const wxString & | name = wxT( "Y" ), |
| int | flags = mpALIGN_CENTER, | ||
| bool | ticks = true ) |
- Parameters
-
name Label to plot by the ruler flags Set position of the scale respect to the window. ticks Select ticks or grid. Give true (default) for drawing axis ticks, false for drawing the grid
Definition at line 1224 of file mathplot.cpp.
References m_flags, m_masterScale, mpScaleBase::m_nameFlags, m_ticks, mpLayer::m_type, mpALIGN_BORDER_LEFT, mpLAYER_AXIS, mpScaleY(), name, mpLayer::SetFont(), mpLayer::SetName(), and mpLayer::SetPen().
Referenced by mpScaleY(), and SetMasterScale().
Member Function Documentation
◆ AbsMaxValue()
|
inlineinherited |
Definition at line 675 of file mathplot.h.
References std::abs(), m_maxV, and m_minV.
◆ AbsVisibleMaxValue()
|
inlineinherited |
Definition at line 680 of file mathplot.h.
References m_absVisibleMaxV.
◆ computeLabelExtents()
|
protectedinherited |
Definition at line 806 of file mathplot.cpp.
References m_maxLabelHeight, m_maxLabelWidth, and m_tickLabels.
Referenced by updateTickLabels().
◆ computeSlaveTicks()
|
protected |
Definition at line 843 of file mathplot.cpp.
References getVisibleDataRange(), mpScaleBase::m_absVisibleMaxV, m_masterScale, mpScaleBase::m_maxV, mpScaleBase::m_minV, mpScaleBase::m_offset, mpScaleBase::m_scale, mpScaleBase::m_tickLabels, mpScaleBase::m_tickValues, and TransformFromPlot().
Referenced by recalculateTicks().
◆ ExtendDataRange()
|
inlinevirtualinherited |
Reimplemented in TIME_SCALE.
Definition at line 649 of file mathplot.h.
References m_maxV, m_minV, and m_rangeSet.
◆ formatLabels()
|
inlineprotectedvirtualinherited |
Reimplemented in LIN_SCALE< mpScaleX >.
Definition at line 733 of file mathplot.h.
Referenced by updateTickLabels().
◆ GetAxisMinMax()
|
inlineinherited |
Definition at line 692 of file mathplot.h.
References m_axisLocked, m_axisMax, m_axisMin, and m_tickValues.
◆ GetBrush()
|
inlineinherited |
Get brush set for this layer.
- Returns
- brush.
Definition at line 299 of file mathplot.h.
References m_brush.
◆ GetContinuity()
|
inlineinherited |
Gets the 'continuity' property of the layer.
- See also
- SetContinuity
Definition at line 264 of file mathplot.h.
References m_continuous.
◆ GetDataRange()
|
inlineinherited |
Definition at line 643 of file mathplot.h.
References m_maxV, and m_minV.
Referenced by mpScaleX::recalculateTicks(), and mpScaleXLog::recalculateTicks().
◆ GetDisplayName()
|
inlineinherited |
Definition at line 241 of file mathplot.h.
References m_displayName, and m_name.
Referenced by mpInfoLegend::Plot().
◆ GetFont()
|
inlineinherited |
Get font set for this layer.
- Returns
- Font
Definition at line 249 of file mathplot.h.
References m_font.
◆ GetLayerType()
|
inlineinherited |
Get layer type: a Layer can be of different types: plot lines, axis, info boxes, etc, this method returns the right value.
- Returns
- An integer indicating layer type
Definition at line 287 of file mathplot.h.
References m_type.
Referenced by mpInfoLegend::Plot().
◆ GetMaxX()
|
inlinevirtualinherited |
Get inclusive right border of bounding box.
- Returns
- Value
Reimplemented in mpFXYVector.
Definition at line 181 of file mathplot.h.
Referenced by mpFXY::UpdateScales().
◆ GetMaxY()
|
inlinevirtualinherited |
Get inclusive top border of bounding box.
- Returns
- Value
Reimplemented in mpFXYVector.
Definition at line 191 of file mathplot.h.
Referenced by mpFXY::UpdateScales().
◆ GetMinX()
|
inlinevirtualinherited |
Get inclusive left border of bounding box.
- Returns
- Value
Reimplemented in mpFXYVector.
Definition at line 176 of file mathplot.h.
Referenced by mpFXY::UpdateScales().
◆ GetMinY()
|
inlinevirtualinherited |
Get inclusive bottom border of bounding box.
- Returns
- Value
Reimplemented in mpFXYVector.
Definition at line 186 of file mathplot.h.
Referenced by mpFXY::UpdateScales().
◆ GetName()
|
inlineinherited |
Get layer name.
- Returns
- Name
Definition at line 239 of file mathplot.h.
References m_name.
Referenced by SIMULATOR_FRAME_UI::updatePlotCursors(), and SIM_PLOT_TAB::UpdateTraceStyle().
◆ GetPen()
|
inlineinherited |
Get pen set for this layer.
- Returns
- Pen
Definition at line 254 of file mathplot.h.
References m_pen.
Referenced by CURSOR::Plot(), mpInfoLegend::Plot(), and SIMULATOR_FRAME_UI::rebuildSignalsGrid().
◆ GetTicks()
|
inlineinherited |
Get X axis ticks or grid.
- Returns
- true if plot is drawing axis ticks, false if the grid is active.
Definition at line 641 of file mathplot.h.
References m_ticks.
◆ getVisibleDataRange()
|
overrideprotectedvirtual |
Reimplemented from mpScaleBase.
Definition at line 830 of file mathplot.cpp.
References mpWindow::GetMarginBottom(), mpWindow::GetMarginTop(), mpWindow::GetScrY(), mpWindow::p2y(), and TransformFromPlot().
Referenced by computeSlaveTicks(), and recalculateTicks().
◆ HasBBox()
|
inlineoverridevirtual |
Check whether this layer has a bounding box.
This implementation returns false thus making the ruler invisible to the plot layer bounding box calculation by mpWindow.
Reimplemented from mpScaleBase.
Definition at line 850 of file mathplot.h.
◆ IsHorizontal()
|
inlineoverridevirtual |
Implements mpScaleBase.
Definition at line 839 of file mathplot.h.
◆ IsInfo()
|
inlinevirtualinherited |
Check whether the layer is an info box.
The default implementation returns false. It is overridden to true for mpInfoLayer class and its derivative. It is necessary to define mouse actions behaviour over info boxes.
- Returns
- whether the layer is an info boxes
- See also
- mpInfoLayer::IsInfo
Reimplemented in mpInfoLayer.
Definition at line 171 of file mathplot.h.
◆ IsVisible()
|
inlineinherited |
Checks whether the layer is visible or not.
- Returns
- true if visible
Definition at line 291 of file mathplot.h.
References m_visible.
Referenced by mpWindow::IsLayerVisible(), and mpInfoLegend::Plot().
◆ Plot()
|
overridevirtual |
Layer plot handler.
This implementation will plot the ruler adjusted to the visible area.
Implements mpLayer.
Definition at line 1237 of file mathplot.cpp.
References mpWindow::GetMarginBottom(), mpWindow::GetMarginLeft(), mpWindow::GetMarginRight(), mpWindow::GetMarginTop(), mpWindow::GetPosY(), mpWindow::GetScaleY(), mpWindow::GetScrX(), mpWindow::GetScrY(), m_flags, mpLayer::m_font, mpScaleBase::m_maxV, mpScaleBase::m_minV, mpLayer::m_name, mpScaleBase::m_nameFlags, mpScaleBase::m_offset, mpLayer::m_pen, mpScaleBase::m_scale, mpScaleBase::m_tickLabels, m_ticks, mpScaleBase::m_tickValues, mpLayer::m_visible, mpALIGN_BORDER_LEFT, mpALIGN_BORDER_RIGHT, mpALIGN_CENTER, mpALIGN_FAR_RIGHT, mpALIGN_LEFT, mpALIGN_RIGHT, recalculateTicks(), tp, TransformToPlot(), and mpWindow::x2p().
◆ recalculateTicks()
|
overrideprotectedvirtual |
Reimplemented from mpScaleBase.
Definition at line 892 of file mathplot.cpp.
References std::abs(), computeSlaveTicks(), getVisibleDataRange(), mpWindow::GetYScreen(), mpScaleBase::m_absVisibleMaxV, mpScaleBase::m_axisLocked, mpScaleBase::m_axisMax, mpScaleBase::m_axisMin, m_masterScale, mpScaleBase::m_offset, mpScaleBase::m_scale, mpScaleBase::m_tickLabels, mpScaleBase::m_tickValues, and mpScaleBase::updateTickLabels().
Referenced by Plot().
◆ ResetDataRange()
|
inlinevirtualinherited |
◆ SetAlign()
|
inlineinherited |
Set X axis alignment.
- Parameters
-
align alignment (choose between mpALIGN_BORDER_BOTTOM, mpALIGN_BOTTOM, mpALIGN_CENTER, mpALIGN_TOP, mpALIGN_BORDER_TOP
Definition at line 629 of file mathplot.h.
References m_flags.
◆ SetAxisMinMax()
|
inlineinherited |
Definition at line 685 of file mathplot.h.
References m_axisLocked, m_axisMax, and m_axisMin.
◆ SetBrush()
|
inlineinherited |
Set layer brush.
- Parameters
-
brush brush, will be copied to internal class member
Definition at line 303 of file mathplot.h.
References m_brush.
◆ SetContinuity()
|
inlineinherited |
Set the 'continuity' property of the layer (true:draws a continuous line, false:draws separate points).
- See also
- GetContinuity
Definition at line 259 of file mathplot.h.
References m_continuous.
Referenced by TRACE::TRACE().
◆ SetFont()
|
inlineinherited |
Set layer font.
- Parameters
-
font Font, will be copied to internal class member
Definition at line 278 of file mathplot.h.
References m_font.
Referenced by mpLayer(), mpScaleXBase::mpScaleXBase(), and mpScaleY::mpScaleY().
◆ SetMasterScale()
|
inline |
Definition at line 855 of file mathplot.h.
References m_masterScale, and mpScaleY().
◆ SetName()
|
inlinevirtualinherited |
Set layer name.
- Parameters
-
name Name, will be copied to internal class member
Reimplemented in TRACE.
Definition at line 273 of file mathplot.h.
Referenced by mpFX::mpFX(), mpFXY::mpFXY(), mpFY::mpFY(), mpScaleXBase::mpScaleXBase(), mpScaleY::mpScaleY(), and TRACE::SetName().
◆ SetNameAlign()
|
inlineinherited |
Definition at line 631 of file mathplot.h.
References m_nameFlags.
◆ SetPen()
|
inlineinherited |
Set layer pen.
- Parameters
-
pen Pen, will be copied to internal class member
Definition at line 283 of file mathplot.h.
References m_pen.
Referenced by mpLayer(), mpScaleXBase::mpScaleXBase(), mpScaleY::mpScaleY(), mpInfoLegend::Plot(), and SIM_PLOT_TAB::UpdateTraceStyle().
◆ SetTicks()
|
inlineinherited |
Set X axis ticks or grid.
- Parameters
-
enable = true to plot axis ticks, false to plot grid.
Definition at line 636 of file mathplot.h.
References m_ticks.
◆ SetVisible()
|
inlineinherited |
Sets layer visibility.
- Parameters
-
show visibility bool.
Definition at line 295 of file mathplot.h.
References m_visible.
◆ ShowName()
|
inlineinherited |
Shows or hides the text label with the name of the layer (default is visible).
Definition at line 268 of file mathplot.h.
References m_showName.
Referenced by TRACE::TRACE().
◆ TransformFromPlot()
|
overridevirtual |
Reimplemented from mpScaleBase.
Definition at line 2631 of file mathplot.cpp.
References mpScaleBase::m_offset, and mpScaleBase::m_scale.
Referenced by computeSlaveTicks(), and getVisibleDataRange().
◆ TransformToPlot()
|
overridevirtual |
Reimplemented from mpScaleBase.
Definition at line 2625 of file mathplot.cpp.
References mpScaleBase::m_offset, and mpScaleBase::m_scale.
Referenced by Plot().
◆ updateTickLabels()
|
protectedinherited |
Definition at line 823 of file mathplot.cpp.
References computeLabelExtents(), and formatLabels().
Referenced by mpScaleX::recalculateTicks(), mpScaleXLog::recalculateTicks(), and mpScaleY::recalculateTicks().
Member Data Documentation
◆ m_absVisibleMaxV
|
protectedinherited |
Definition at line 740 of file mathplot.h.
Referenced by AbsVisibleMaxValue(), mpScaleY::computeSlaveTicks(), mpScaleBase(), mpScaleX::recalculateTicks(), and mpScaleY::recalculateTicks().
◆ m_axisLocked
|
protectedinherited |
Definition at line 746 of file mathplot.h.
Referenced by GetAxisMinMax(), mpScaleBase(), mpScaleY::recalculateTicks(), and SetAxisMinMax().
◆ m_axisMax
|
protectedinherited |
Definition at line 748 of file mathplot.h.
Referenced by GetAxisMinMax(), mpScaleBase(), mpScaleY::recalculateTicks(), and SetAxisMinMax().
◆ m_axisMin
|
protectedinherited |
Definition at line 747 of file mathplot.h.
Referenced by GetAxisMinMax(), mpScaleBase(), mpScaleY::recalculateTicks(), and SetAxisMinMax().
◆ m_brush
|
protectedinherited |
Definition at line 309 of file mathplot.h.
Referenced by GetBrush(), and SetBrush().
◆ m_continuous
|
protectedinherited |
Definition at line 312 of file mathplot.h.
Referenced by GetContinuity(), mpLayer(), CURSOR::Plot(), mpFXY::Plot(), and SetContinuity().
◆ m_displayName
|
protectedinherited |
Definition at line 311 of file mathplot.h.
Referenced by GetDisplayName(), and TRACE::SetName().
◆ m_flags
|
protected |
Definition at line 864 of file mathplot.h.
Referenced by mpScaleY(), and Plot().
◆ m_font
|
protectedinherited |
Definition at line 307 of file mathplot.h.
Referenced by GetFont(), mpFX::Plot(), mpFXY::Plot(), mpFY::Plot(), mpInfoLegend::Plot(), mpScaleXBase::Plot(), mpScaleY::Plot(), and SetFont().
◆ m_masterScale
|
protected |
Definition at line 863 of file mathplot.h.
Referenced by computeSlaveTicks(), mpScaleY(), recalculateTicks(), and SetMasterScale().
◆ m_maxLabelHeight
|
protectedinherited |
Definition at line 749 of file mathplot.h.
Referenced by computeLabelExtents(), mpScaleBase(), and mpScaleXBase::Plot().
◆ m_maxLabelWidth
|
protectedinherited |
Definition at line 750 of file mathplot.h.
Referenced by computeLabelExtents(), and mpScaleBase().
◆ m_maxV
|
protectedinherited |
Definition at line 744 of file mathplot.h.
Referenced by AbsMaxValue(), mpScaleY::computeSlaveTicks(), ExtendDataRange(), TIME_SCALE::ExtendDataRange(), GetDataRange(), mpScaleBase(), mpScaleXBase::Plot(), mpScaleY::Plot(), TIME_SCALE::ResetDataRange(), mpScaleXLog::TransformFromPlot(), and mpScaleXLog::TransformToPlot().
◆ m_minV
|
protectedinherited |
Definition at line 744 of file mathplot.h.
Referenced by AbsMaxValue(), mpScaleY::computeSlaveTicks(), ExtendDataRange(), TIME_SCALE::ExtendDataRange(), GetDataRange(), mpScaleBase(), mpScaleXBase::Plot(), mpScaleY::Plot(), TIME_SCALE::ResetDataRange(), mpScaleXLog::TransformFromPlot(), and mpScaleXLog::TransformToPlot().
◆ m_name
|
protectedinherited |
Definition at line 310 of file mathplot.h.
Referenced by GetDisplayName(), GetName(), mpFX::Plot(), mpFXY::Plot(), mpFY::Plot(), mpScaleXBase::Plot(), mpScaleY::Plot(), and SetName().
◆ m_nameFlags
|
protectedinherited |
Definition at line 742 of file mathplot.h.
Referenced by mpScaleBase(), mpScaleY::mpScaleY(), mpScaleXBase::Plot(), mpScaleY::Plot(), and SetNameAlign().
◆ m_offset
|
protectedinherited |
Definition at line 739 of file mathplot.h.
Referenced by mpScaleY::computeSlaveTicks(), mpScaleBase(), mpScaleXBase::Plot(), mpScaleY::Plot(), mpScaleY::recalculateTicks(), mpScaleX::TransformFromPlot(), mpScaleY::TransformFromPlot(), mpScaleX::TransformToPlot(), and mpScaleY::TransformToPlot().
◆ m_pen
|
protectedinherited |
Definition at line 308 of file mathplot.h.
Referenced by GetPen(), mpFX::Plot(), mpFXY::Plot(), mpFY::Plot(), mpInfoLayer::Plot(), mpInfoLegend::Plot(), mpScaleXBase::Plot(), mpScaleY::Plot(), and SetPen().
◆ m_rangeSet
|
protectedinherited |
Definition at line 745 of file mathplot.h.
Referenced by ExtendDataRange(), mpScaleBase(), ResetDataRange(), and TIME_SCALE::ResetDataRange().
◆ m_scale
|
protectedinherited |
Definition at line 739 of file mathplot.h.
Referenced by mpScaleY::computeSlaveTicks(), mpScaleBase(), mpScaleXBase::Plot(), mpScaleY::Plot(), mpScaleY::recalculateTicks(), mpScaleX::TransformFromPlot(), mpScaleY::TransformFromPlot(), mpScaleX::TransformToPlot(), and mpScaleY::TransformToPlot().
◆ m_showName
|
protectedinherited |
Definition at line 313 of file mathplot.h.
Referenced by mpLayer(), mpFX::Plot(), mpFXY::Plot(), mpFY::Plot(), and ShowName().
◆ m_tickLabels
|
protectedinherited |
Definition at line 737 of file mathplot.h.
Referenced by computeLabelExtents(), mpScaleY::computeSlaveTicks(), mpScaleXBase::Plot(), mpScaleY::Plot(), mpScaleX::recalculateTicks(), mpScaleXLog::recalculateTicks(), and mpScaleY::recalculateTicks().
◆ m_ticks
|
protected |
Definition at line 865 of file mathplot.h.
Referenced by mpScaleY(), and Plot().
◆ m_tickValues
|
protectedinherited |
Definition at line 736 of file mathplot.h.
Referenced by mpScaleY::computeSlaveTicks(), GetAxisMinMax(), mpScaleXBase::Plot(), mpScaleY::Plot(), mpScaleX::recalculateTicks(), mpScaleXLog::recalculateTicks(), and mpScaleY::recalculateTicks().
◆ m_type
|
protectedinherited |
Definition at line 314 of file mathplot.h.
Referenced by GetLayerType(), mpFX::mpFX(), mpFXY::mpFXY(), mpFXYVector::mpFXYVector(), mpFY::mpFY(), mpInfoLayer::mpInfoLayer(), mpInfoLayer::mpInfoLayer(), mpLayer(), mpScaleXBase::mpScaleXBase(), and mpScaleY::mpScaleY().
◆ m_visible
|
protectedinherited |
Definition at line 315 of file mathplot.h.
Referenced by IsVisible(), mpLayer(), CURSOR::Plot(), mpFX::Plot(), mpFXY::Plot(), mpFY::Plot(), mpInfoLayer::Plot(), mpInfoLegend::Plot(), mpScaleXBase::Plot(), mpScaleY::Plot(), and SetVisible().
The documentation for this class was generated from the following files: