 |
KiCad PCB EDA Suite
|
|
KiCad PCB EDA Suite
|
Plot layer implementing a x-scale ruler. More...
#include <mathplot.h>
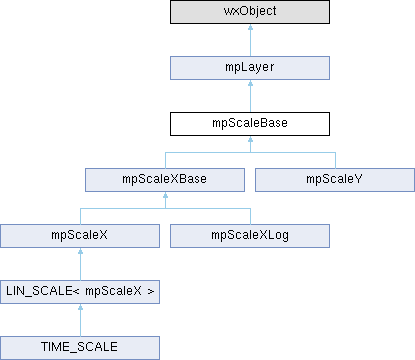
Classes | |
| struct | TICK_LABEL |
Public Member Functions | |
| mpScaleBase () | |
| virtual | ~mpScaleBase () |
| virtual bool | IsHorizontal () const =0 |
| bool | HasBBox () const override |
| Check whether this layer has a bounding box. | |
| void | SetAlign (int align) |
| Set X axis alignment. | |
| void | SetNameAlign (int align) |
| void | SetTicks (bool enable) |
| Set X axis ticks or grid. | |
| bool | GetTicks () const |
| Get X axis ticks or grid. | |
| void | GetDataRange (double &minV, double &maxV) const |
| virtual void | ExtendDataRange (double minV, double maxV) |
| void | SetDataRange (double minV, double maxV) |
| Force this axis' data range to an explicit [minV, maxV], as if it had been computed by ExtendDataRange(). | |
| virtual void | ResetDataRange () |
| double | AbsMaxValue () const |
| double | AbsVisibleMaxValue () const |
| void | SetAxisMinMax (bool lock, double minV, double maxV) |
| bool | GetAxisMinMax (double *minV, double *maxV) |
| virtual double | TransformToPlot (double x) const |
| virtual double | TransformFromPlot (double xplot) const |
| virtual bool | IsInfo () const |
| Check whether the layer is an info box. | |
| virtual double | GetMinX () const |
| Get inclusive left border of bounding box. | |
| virtual double | GetMaxX () const |
| Get inclusive right border of bounding box. | |
| virtual double | GetMinY () const |
| Get inclusive bottom border of bounding box. | |
| virtual double | GetMaxY () const |
| Get inclusive top border of bounding box. | |
| virtual void | Plot (wxDC &dc, mpWindow &w)=0 |
| Plot given view of layer to the given device context. | |
| const wxString & | GetName () const |
| Get layer name. | |
| const wxString & | GetDisplayName () const |
| const wxFont & | GetFont () const |
| Get font set for this layer. | |
| const wxFont & | GetPlotFont () const |
| Get the font to draw this layer with, which is the default one when none was set. | |
| const wxPen & | GetPen () const |
| Get pen set for this layer. | |
| void | SetContinuity (bool continuity) |
| Set the 'continuity' property of the layer (true:draws a continuous line, false:draws separate points). | |
| bool | GetContinuity () const |
| Gets the 'continuity' property of the layer. | |
| void | ShowName (bool show) |
| Shows or hides the text label with the name of the layer (default is visible). | |
| virtual void | SetName (const wxString &name) |
| Set layer name. | |
| void | SetFont (const wxFont &font) |
| Set layer font. | |
| void | SetPen (const wxPen &pen) |
| Set layer pen. | |
| mpLayerType | GetLayerType () const |
| Get layer type: a Layer can be of different types: plot lines, axis, info boxes, etc, this method returns the right value. | |
| bool | IsVisible () const |
| Checks whether the layer is visible or not. | |
| void | SetVisible (bool show) |
| Sets layer visibility. | |
| const wxBrush & | GetBrush () const |
| Get brush set for this layer. | |
| void | SetBrush (const wxBrush &brush) |
| Set layer brush. | |
Protected Member Functions | |
| void | updateTickLabels (wxDC &dc, mpWindow &w) |
| void | computeLabelExtents (wxDC &dc, mpWindow &w) |
| virtual void | getVisibleDataRange (mpWindow &w, double &minV, double &maxV) |
| virtual void | recalculateTicks (wxDC &dc, mpWindow &w) |
| virtual void | formatLabels () |
Protected Attributes | |
| std::vector< double > | m_tickValues |
| std::vector< TICK_LABEL > | m_tickLabels |
| double | m_offset |
| double | m_scale |
| double | m_absVisibleMaxV |
| int | m_flags |
| int | m_nameFlags |
| bool | m_ticks |
| double | m_minV |
| double | m_maxV |
| bool | m_rangeSet |
| bool | m_axisLocked |
| double | m_axisMin |
| double | m_axisMax |
| int | m_maxLabelHeight |
| int | m_maxLabelWidth |
| wxFont | m_font |
| Layer's font. | |
| wxPen | m_pen |
| Layer's pen. | |
| wxBrush | m_brush |
| Layer's brush. | |
| wxString | m_name |
| Layer's name. | |
| wxString | m_displayName |
| bool | m_continuous |
| Specify if the layer will be plotted as a continuous line or a set of points. | |
| bool | m_showName |
| States whether the name of the layer must be shown (default is true). | |
| mpLayerType | m_type |
| Define layer type, which is assigned by constructor. | |
| bool | m_visible |
| Toggles layer visibility. | |
Plot layer implementing a x-scale ruler.
The ruler is fixed at Y=0 in the coordinate system. A label is plotted at the bottom-right hand of the ruler. The scale numbering automatically adjusts to view and zoom factor.
Definition at line 651 of file mathplot.h.
| mpScaleBase::mpScaleBase | ( | ) |
Definition at line 858 of file mathplot.cpp.
References m_absVisibleMaxV, m_axisLocked, m_axisMax, m_axisMin, m_flags, m_maxLabelHeight, m_maxLabelWidth, m_maxV, m_minV, m_nameFlags, m_offset, m_rangeSet, m_scale, m_ticks, and mpALIGN_BORDER_BOTTOM.
|
inlinevirtual |
Definition at line 655 of file mathplot.h.
|
inline |
Definition at line 728 of file mathplot.h.
References std::abs(), m_maxV, and m_minV.
|
inline |
Definition at line 733 of file mathplot.h.
References m_absVisibleMaxV.
|
protected |
Definition at line 879 of file mathplot.cpp.
References m_maxLabelHeight, m_maxLabelWidth, and m_tickLabels.
Referenced by updateTickLabels().
|
inlinevirtual |
Reimplemented in TIME_SCALE.
Definition at line 685 of file mathplot.h.
References m_maxV, m_minV, and m_rangeSet.
|
inlineprotectedvirtual |
Reimplemented in LIN_SCALE< mpScaleX >.
Definition at line 786 of file mathplot.h.
Referenced by updateTickLabels().
|
inline |
Definition at line 745 of file mathplot.h.
References m_axisLocked, m_axisMax, m_axisMin, and m_tickValues.
|
inlineinherited |
Get brush set for this layer.
Definition at line 332 of file mathplot.h.
References m_brush.
|
inlineinherited |
Gets the 'continuity' property of the layer.
Definition at line 297 of file mathplot.h.
References m_continuous.
|
inline |
Definition at line 679 of file mathplot.h.
References m_maxV, and m_minV.
Referenced by mpScaleX::recalculateTicks(), and mpScaleXLog::recalculateTicks().
|
inlineinherited |
Definition at line 258 of file mathplot.h.
References m_displayName, and m_name.
Referenced by mpInfoLegend::Plot().
|
inlineinherited |
Get font set for this layer.
Invalid if none was set.
Definition at line 266 of file mathplot.h.
References m_font.
Referenced by BOOST_AUTO_TEST_CASE().
|
inlineinherited |
Get layer type: a Layer can be of different types: plot lines, axis, info boxes, etc, this method returns the right value.
Definition at line 320 of file mathplot.h.
References m_type.
Referenced by mpInfoLegend::Plot().
|
inlinevirtualinherited |
Get inclusive right border of bounding box.
Reimplemented in mpFXYVector.
Definition at line 198 of file mathplot.h.
Referenced by mpFXY::UpdateScales().
|
inlinevirtualinherited |
Get inclusive top border of bounding box.
Reimplemented in mpFXYVector.
Definition at line 208 of file mathplot.h.
Referenced by mpFXY::UpdateScales().
|
inlinevirtualinherited |
Get inclusive left border of bounding box.
Reimplemented in mpFXYVector.
Definition at line 193 of file mathplot.h.
Referenced by mpFXY::UpdateScales().
|
inlinevirtualinherited |
Get inclusive bottom border of bounding box.
Reimplemented in mpFXYVector.
Definition at line 203 of file mathplot.h.
Referenced by mpFXY::UpdateScales().
|
inlineinherited |
Get layer name.
Definition at line 256 of file mathplot.h.
References m_name.
Referenced by SIMULATOR_FRAME_UI::ToggleSmithChart(), SIMULATOR_FRAME_UI::updatePlotCursors(), and SIM_PLOT_TAB::UpdateTraceStyle().
|
inlineinherited |
Get pen set for this layer.
Definition at line 287 of file mathplot.h.
References m_pen.
Referenced by CURSOR::Plot(), mpInfoLegend::Plot(), SMITH_CURSOR::Plot(), SIMULATOR_FRAME_UI::rebuildSignalsGrid(), and SIMULATOR_FRAME_UI::signalsGridCursorUpdate().
|
inlineinherited |
Get the font to draw this layer with, which is the default one when none was set.
The stock fonts are built on first use from the running toolkit, so this must not be called before there is one; layers resolve their font when they plot, not when they are constructed.
Definition at line 276 of file mathplot.h.
References m_font.
Referenced by BOOST_AUTO_TEST_CASE(), mpFX::Plot(), mpFXY::Plot(), mpFY::Plot(), mpInfoLegend::Plot(), mpScaleXBase::Plot(), mpScaleY::Plot(), SMITH_CURSOR::Plot(), and SMITH_GRID::Plot().
|
inline |
Get X axis ticks or grid.
Definition at line 677 of file mathplot.h.
References m_ticks.
|
inlineprotectedvirtual |
Reimplemented in mpScaleXBase, and mpScaleY.
Definition at line 783 of file mathplot.h.
|
inlineoverridevirtual |
Check whether this layer has a bounding box.
The default implementation returns true. Override and return false if your mpLayer implementation should be ignored by the calculation of the global bounding box for all layers in a mpWindow.
| true | Has bounding box |
| false | Has not bounding box |
Reimplemented from mpLayer.
Reimplemented in mpScaleY.
Definition at line 659 of file mathplot.h.
|
pure virtual |
Implemented in mpScaleXBase, and mpScaleY.
|
inlinevirtualinherited |
Check whether the layer is an info box.
The default implementation returns false. It is overridden to true for mpInfoLayer class and its derivative. It is necessary to define mouse actions behaviour over info boxes.
Reimplemented in mpInfoLayer.
Definition at line 188 of file mathplot.h.
|
inlineinherited |
Checks whether the layer is visible or not.
Definition at line 324 of file mathplot.h.
References m_visible.
Referenced by mpWindow::IsLayerVisible(), and mpInfoLegend::Plot().
|
pure virtualinherited |
Plot given view of layer to the given device context.
An implementation of this function has to transform layer coordinates to wxDC coordinates based on the view parameters retrievable from the mpWindow passed in w. Note that the public methods of mpWindow: x2p,y2p and p2x,p2y are already provided which transform layer coordinates to DC pixel coordinates, and user code should rely on them for portability and future changes to be applied transparently, instead of implementing the following formulas manually.
The passed device context dc has its coordinate origin set to the top-left corner of the visible area (the default). The coordinate orientation is as shown in the following picture:
(wxDC origin 0,0)
x-------------> ascending X ----------------+
|                                           |
|                                           |
|  V ascending Y                            |
|                                           |
|                                           |
|                                           |
|+------------------------------------------+  <-- right-bottom corner of the mpWindow visible area.
Note that Y ascends in downward direction, whereas the usual vertical orientation for mathematical plots is vice versa. Thus Y-orientation will be swapped usually, when transforming between wxDC and mpLayer coordinates. This change of coordinates is taken into account in the methods p2x,p2y,x2p,y2p.
Rules for transformation between mpLayer and wxDC coordinates
| dc | Device context to plot to. |
| w | View to plot. The visible area can be retrieved from this object. |
Implemented in CURSOR, mpFX, mpFXY, mpFY, mpInfoLayer, mpInfoLegend, mpScaleXBase, mpScaleY, SMITH_CURSOR, SMITH_GRID, and SMITH_TRACE.
|
inlineprotectedvirtual |
Reimplemented in mpScaleX, mpScaleXLog, and mpScaleY.
Definition at line 784 of file mathplot.h.
Referenced by mpScaleXBase::Plot().
|
inlinevirtual |
|
inline |
Set X axis alignment.
| align | alignment (choose between mpALIGN_BORDER_BOTTOM, mpALIGN_BOTTOM, mpALIGN_CENTER, mpALIGN_TOP, mpALIGN_BORDER_TOP |
Definition at line 665 of file mathplot.h.
References m_flags.
|
inline |
Definition at line 738 of file mathplot.h.
References m_axisLocked, m_axisMax, and m_axisMin.
|
inlineinherited |
Set layer brush.
| brush | brush, will be copied to internal class member |
Definition at line 336 of file mathplot.h.
References m_brush.
|
inlineinherited |
Set the 'continuity' property of the layer (true:draws a continuous line, false:draws separate points).
Definition at line 292 of file mathplot.h.
References m_continuous.
Referenced by TRACE::TRACE().
|
inline |
Force this axis' data range to an explicit [minV, maxV], as if it had been computed by ExtendDataRange().
Used to synchronize the Y-axis range across views when signals are routed to share another view's Y-axis scale (see SIM_PLOT_TAB's "Y Scale" column).
Definition at line 710 of file mathplot.h.
References m_maxV, m_minV, and m_rangeSet.
|
inlineinherited |
Set layer font.
| font | Font, will be copied to internal class member |
Definition at line 311 of file mathplot.h.
References m_font.
Referenced by BOOST_AUTO_TEST_CASE().
|
inlinevirtualinherited |
Set layer name.
| name | Name, will be copied to internal class member |
Reimplemented in TRACE.
Definition at line 306 of file mathplot.h.
Referenced by mpFX::mpFX(), mpFXY::mpFXY(), mpFY::mpFY(), mpScaleXBase::mpScaleXBase(), mpScaleY::mpScaleY(), and TRACE::SetName().
|
inline |
Definition at line 667 of file mathplot.h.
References m_nameFlags.
|
inlineinherited |
Set layer pen.
| pen | Pen, will be copied to internal class member |
Definition at line 316 of file mathplot.h.
References m_pen.
Referenced by mpLayer(), mpScaleXBase::mpScaleXBase(), mpScaleY::mpScaleY(), mpInfoLegend::Plot(), and SIM_PLOT_TAB::UpdateTraceStyle().
|
inline |
Set X axis ticks or grid.
| enable | = true to plot axis ticks, false to plot grid. |
Definition at line 672 of file mathplot.h.
References m_ticks.
|
inlineinherited |
Sets layer visibility.
| show | visibility bool. |
Definition at line 328 of file mathplot.h.
References m_visible.
Referenced by SIM_PLOT_TAB::AddView().
|
inlineinherited |
Shows or hides the text label with the name of the layer (default is visible).
Definition at line 301 of file mathplot.h.
References m_showName.
Referenced by TRACE::TRACE().
|
inlinevirtual |
Reimplemented in mpScaleX, mpScaleXLog, and mpScaleY.
Definition at line 762 of file mathplot.h.
Referenced by mpScaleXBase::getVisibleDataRange().
|
inlinevirtual |
Reimplemented in mpScaleX, mpScaleXLog, and mpScaleY.
Definition at line 761 of file mathplot.h.
Referenced by mpScaleXBase::Plot().
|
protected |
Definition at line 896 of file mathplot.cpp.
References computeLabelExtents(), and formatLabels().
Referenced by mpScaleX::recalculateTicks(), mpScaleXLog::recalculateTicks(), and mpScaleY::recalculateTicks().
|
protected |
Definition at line 793 of file mathplot.h.
Referenced by AbsVisibleMaxValue(), mpScaleY::computeSlaveTicks(), mpScaleBase(), mpScaleX::recalculateTicks(), and mpScaleY::recalculateTicks().
|
protected |
Definition at line 799 of file mathplot.h.
Referenced by GetAxisMinMax(), mpScaleBase(), mpScaleY::recalculateTicks(), and SetAxisMinMax().
|
protected |
Definition at line 801 of file mathplot.h.
Referenced by GetAxisMinMax(), mpScaleBase(), mpScaleY::recalculateTicks(), and SetAxisMinMax().
|
protected |
Definition at line 800 of file mathplot.h.
Referenced by GetAxisMinMax(), mpScaleBase(), mpScaleY::recalculateTicks(), and SetAxisMinMax().
|
protectedinherited |
|
protectedinherited |
Specify if the layer will be plotted as a continuous line or a set of points.
Definition at line 345 of file mathplot.h.
Referenced by GetContinuity(), mpLayer(), CURSOR::Plot(), mpFXY::Plot(), and SetContinuity().
|
protectedinherited |
Definition at line 344 of file mathplot.h.
Referenced by GetDisplayName(), and TRACE::SetName().
|
protected |
Definition at line 794 of file mathplot.h.
Referenced by mpScaleBase(), mpScaleXBase::mpScaleXBase(), mpScaleXBase::Plot(), and SetAlign().
|
protectedinherited |
Layer's font.
Definition at line 340 of file mathplot.h.
Referenced by GetFont(), GetPlotFont(), and SetFont().
|
protected |
Definition at line 802 of file mathplot.h.
Referenced by computeLabelExtents(), mpScaleBase(), and mpScaleXBase::Plot().
|
protected |
Definition at line 803 of file mathplot.h.
Referenced by computeLabelExtents(), and mpScaleBase().
|
protected |
Definition at line 797 of file mathplot.h.
Referenced by AbsMaxValue(), mpScaleY::computeSlaveTicks(), ExtendDataRange(), TIME_SCALE::ExtendDataRange(), GetDataRange(), mpScaleBase(), mpScaleXBase::Plot(), mpScaleY::Plot(), TIME_SCALE::ResetDataRange(), SetDataRange(), mpScaleXLog::TransformFromPlot(), and mpScaleXLog::TransformToPlot().
|
protected |
Definition at line 797 of file mathplot.h.
Referenced by AbsMaxValue(), mpScaleY::computeSlaveTicks(), ExtendDataRange(), TIME_SCALE::ExtendDataRange(), GetDataRange(), mpScaleBase(), mpScaleXBase::Plot(), mpScaleY::Plot(), TIME_SCALE::ResetDataRange(), SetDataRange(), mpScaleXLog::TransformFromPlot(), and mpScaleXLog::TransformToPlot().
|
protectedinherited |
Layer's name.
Definition at line 343 of file mathplot.h.
Referenced by GetDisplayName(), GetName(), mpFX::Plot(), mpFXY::Plot(), mpFY::Plot(), mpScaleXBase::Plot(), mpScaleY::Plot(), and SetName().
|
protected |
Definition at line 795 of file mathplot.h.
Referenced by mpScaleBase(), mpScaleY::mpScaleY(), mpScaleXBase::Plot(), mpScaleY::Plot(), and SetNameAlign().
|
protected |
Definition at line 792 of file mathplot.h.
Referenced by mpScaleY::computeSlaveTicks(), mpScaleBase(), mpScaleXBase::Plot(), mpScaleY::Plot(), mpScaleY::recalculateTicks(), mpScaleX::TransformFromPlot(), mpScaleY::TransformFromPlot(), mpScaleX::TransformToPlot(), and mpScaleY::TransformToPlot().
|
protectedinherited |
Layer's pen.
Definition at line 341 of file mathplot.h.
Referenced by GetPen(), mpFX::Plot(), mpFXY::Plot(), mpFY::Plot(), mpInfoLayer::Plot(), mpInfoLegend::Plot(), mpScaleXBase::Plot(), mpScaleY::Plot(), SMITH_GRID::Plot(), SMITH_TRACE::Plot(), and SetPen().
|
protected |
Definition at line 798 of file mathplot.h.
Referenced by ExtendDataRange(), mpScaleBase(), ResetDataRange(), TIME_SCALE::ResetDataRange(), and SetDataRange().
|
protected |
Definition at line 792 of file mathplot.h.
Referenced by mpScaleY::computeSlaveTicks(), mpScaleBase(), mpScaleXBase::Plot(), mpScaleY::Plot(), mpScaleY::recalculateTicks(), mpScaleX::TransformFromPlot(), mpScaleY::TransformFromPlot(), mpScaleX::TransformToPlot(), and mpScaleY::TransformToPlot().
|
protectedinherited |
States whether the name of the layer must be shown (default is true).
Definition at line 346 of file mathplot.h.
Referenced by mpLayer(), mpFX::Plot(), mpFXY::Plot(), mpFY::Plot(), and ShowName().
|
protected |
Definition at line 790 of file mathplot.h.
Referenced by computeLabelExtents(), mpScaleY::computeSlaveTicks(), mpScaleXBase::Plot(), mpScaleY::Plot(), mpScaleX::recalculateTicks(), mpScaleXLog::recalculateTicks(), and mpScaleY::recalculateTicks().
|
protected |
Definition at line 796 of file mathplot.h.
Referenced by GetTicks(), mpScaleBase(), mpScaleXBase::mpScaleXBase(), mpScaleXBase::Plot(), and SetTicks().
|
protected |
Definition at line 789 of file mathplot.h.
Referenced by mpScaleY::computeSlaveTicks(), GetAxisMinMax(), mpScaleXBase::Plot(), mpScaleY::Plot(), mpScaleX::recalculateTicks(), mpScaleXLog::recalculateTicks(), and mpScaleY::recalculateTicks().
|
protectedinherited |
Define layer type, which is assigned by constructor.
Definition at line 347 of file mathplot.h.
Referenced by GetLayerType(), mpFX::mpFX(), mpFXY::mpFXY(), mpFXYVector::mpFXYVector(), mpFY::mpFY(), mpInfoLayer::mpInfoLayer(), mpInfoLayer::mpInfoLayer(), mpLayer(), mpScaleXBase::mpScaleXBase(), mpScaleY::mpScaleY(), and SMITH_GRID::SMITH_GRID().
|
protectedinherited |
Toggles layer visibility.
Definition at line 348 of file mathplot.h.
Referenced by IsVisible(), mpLayer(), CURSOR::Plot(), mpFX::Plot(), mpFXY::Plot(), mpFY::Plot(), mpInfoLayer::Plot(), mpInfoLegend::Plot(), mpScaleXBase::Plot(), mpScaleY::Plot(), SMITH_CURSOR::Plot(), SMITH_GRID::Plot(), SMITH_TRACE::Plot(), and SetVisible().
 1.13.2